KCachegrind
分类: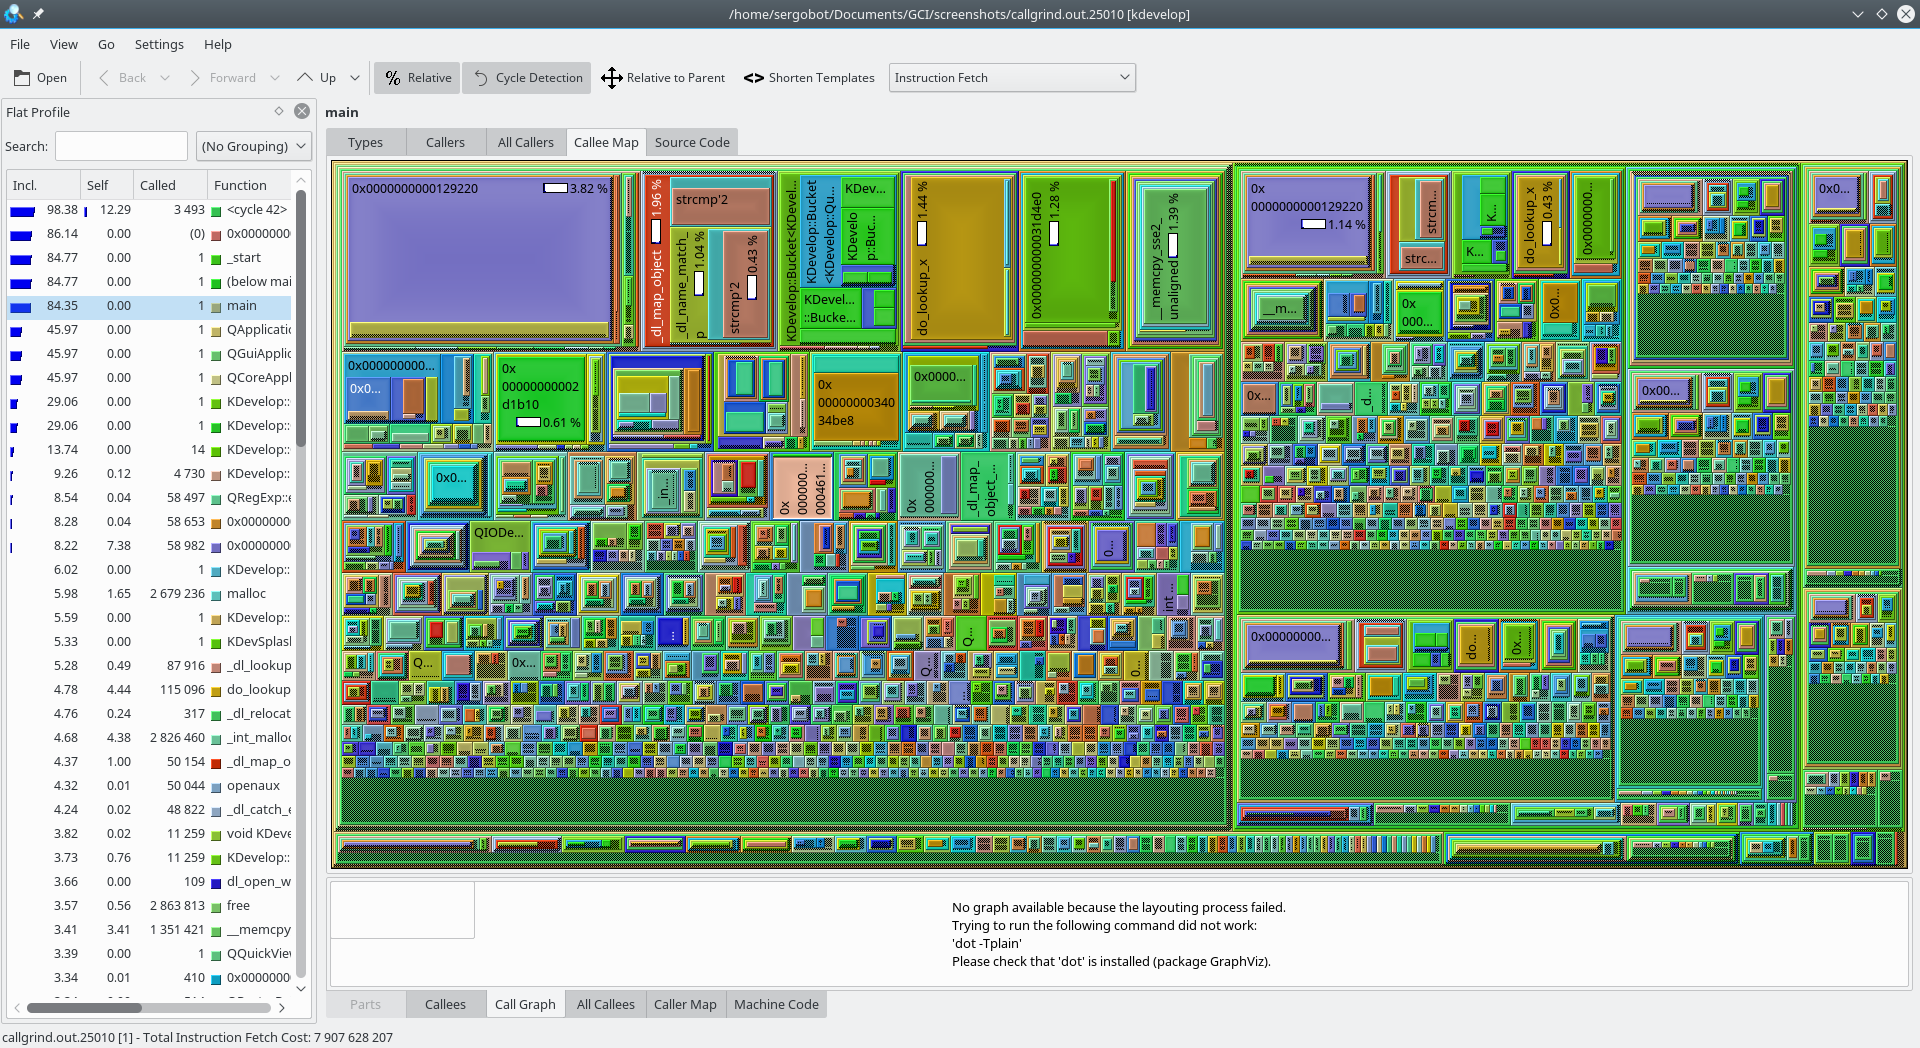
KCachegrind is a profile data visualization tool, used to determine the most time consuming parts in the execution of a program.
Features:
- KCachegrind visualizes profiles (i.e. runtime characteristics) of applications in various ways, including call graph visualisations and source/disassembler annotation.
- It can load profiles generated by the cache simulation/call tracer Calltree, a Valgrind tool. Thus, profiling does not need any preparation, can cope with shared libraries and plugin architectures, and does not influence the measuring itself.
- Converter scripts for OProfile, Perl, and PHP.
- Switching between multiple visualization layouts.
- Call graph can be exported as image (PNG).
- Simultaneous display of 2 event types in Call and Annotation View


软件版本 RSS
24.02.2
2024-04-11
24.02.1
2024-03-21
24.02.0
2024-02-28
23.08.5
2024-02-15